We have added a new widget to your WordPress Dashboard. Now you can see your Google Analytics right from your site’s back end.
When you first log in to your site, you are in the WordPress Dashboard. It will look something like this:

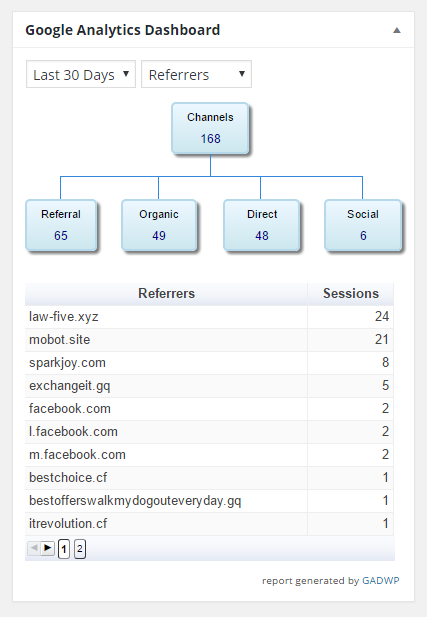
You may need to scroll down to find the Google Analytics widget, which looks something like this:

Time Frames
You can select different time frames to see your site’s statistics. In the above screen shot it is set to Last 30 Days. The time frames available are Real Time, Today, Yesterday, Last 7 Days, Last 14 Days, Last 30 Days, Last 90 Days, One Year, and Three Years.
Real Time shows you how many people are visiting your site right now, and what page(s) they are on. It will also tell you details of how these visitors came to your site (typed in the URL directly, clicked a link from another site, clicked a link from a social media post, etc.), and whether they are a new or returning visitor.

The other time frames — Today, Yesterday, Last 7 Days, Last 14 Days, Last 30 Days, Last 90 Days, One Year, and Three Years — all come with a list of report options, which are explained below.
Report Options
Once you’ve selected a time frame, you can choose from a list of different reports.
Sessions: This shows you how many sessions have occurred each day in the given time frame. Google defines a session as “a group of interactions that take place on your website within a given time frame. For example a single session can contain multiple screen or page views, events, social interactions, and ecommerce transactions.”
Users: This shows you how many different users have visited your site each day in the given time frame
Organic: This shows how many people came to your site from an organic search each day in the given time frame. In other words, they searched for something on Google, saw your site in the search results, and clicked the link to visit your site. Organic search is different from clicking a paid ad.
Page Views: This shows you how many pages were viewed each day in the given time frame.
Bounce Rate: The bounce rate is the percentage of visitors who came to your site, and then left without clicking on anything, or interacting with the site in any way.
The above reports all give you a line graph. Hovering your mouse over a point in the line graph will tell you the number for that day, or that hour time frame if you have selected a single-day time frame.

Location: This breaks down the sessions in the given time frame to show which country the site visitor is from.

Pages: This shows how many times each page has been viewed in the given time frame.

Referrers: This lists other sites that link to yours, and shows you the number of sessions that resulted from people clicking the link on each site. note that you may see some odd sites listed here… some people try to entice you to visit their site by linking to yours.

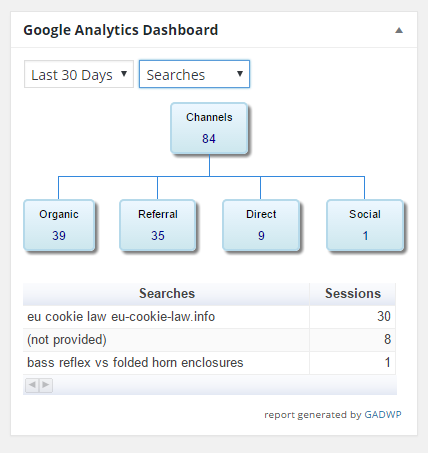
Searches: This lists the different search terms people have used, found your site, and clicked the link to visit your site. It also shows how many sessions were initiated from people finding your site through a search in the given time frame.

Traffic: This gives you a series of charts that show different Traffic Mediums (organic search, directly typing in the web address, clicking a link from a different site), Visitor Type (new vs returning visitor), Search Engines (Google, Bing, Yahoo, etc.), and Social Networks (Facebook, Twitter, LinkedIn, Reddit, etc.). Simply hover your mouse over the pie chart to see what that slice represents.

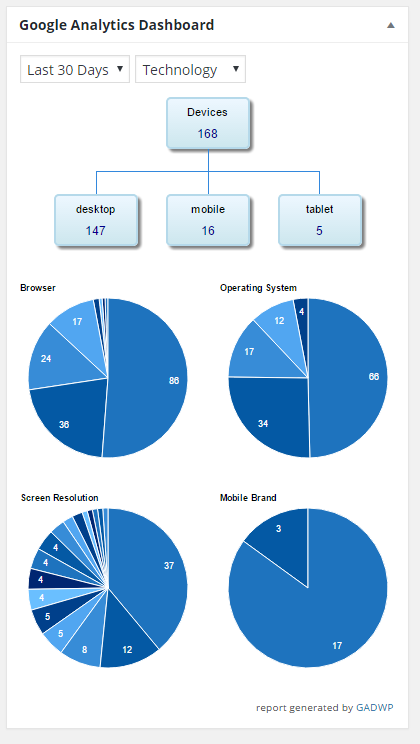
Technology: This gives you a series of pie charts that show which Browser (Chrome, Firefox, Safari, etc.), Operating System (Windows, Mac OS, iOS, Andriod, etc.), Screen Resolution, and Mobile Brand (Apple, Samsung, etc.) your site’s visitors are using. Just as with traffic, hover your mouse over the chart to see what that slice represents.


